The year kicked off as more of a fizzle than a bang, as Sydney’s property market showed a general slowing down with slight negative returns month on month throughout the quarter, compared to the positive returns that featured throughout 2021. The market in both the Eastern Suburbs and Paddington were reflective of this blanket cool down. Many economic and global factors came into play. Specifically in Sydney, these elements included everything from banks reducing their servicing calculations resulting in less available funds, to the perceived possible increase in interest rates, more properties flooding the market, and a generalized fear of inflation fuelled by media discussions, buyers were reluctant to take the plunge. As Kane Dunkley, from PPD Real Estate in Woollahra, said, “This pull back from buyers hasn’t had a major effect on prices as yet but it has affected the time it takes us to get to a result. Properties are sitting on market for longer as buyers are spending more time doing due diligence and working out exactly where they see value before making a move”. A slight easing of competition surprisingly enticed a higher number of owners to request appraisals, especially those upsizing and therefore willing to reduce their asking price to suit the current climate in order to buy back into a less competitive market.
The below chart shows supply, which sits higher than the same time last year, in fact the highest Q1 levels since 2015.
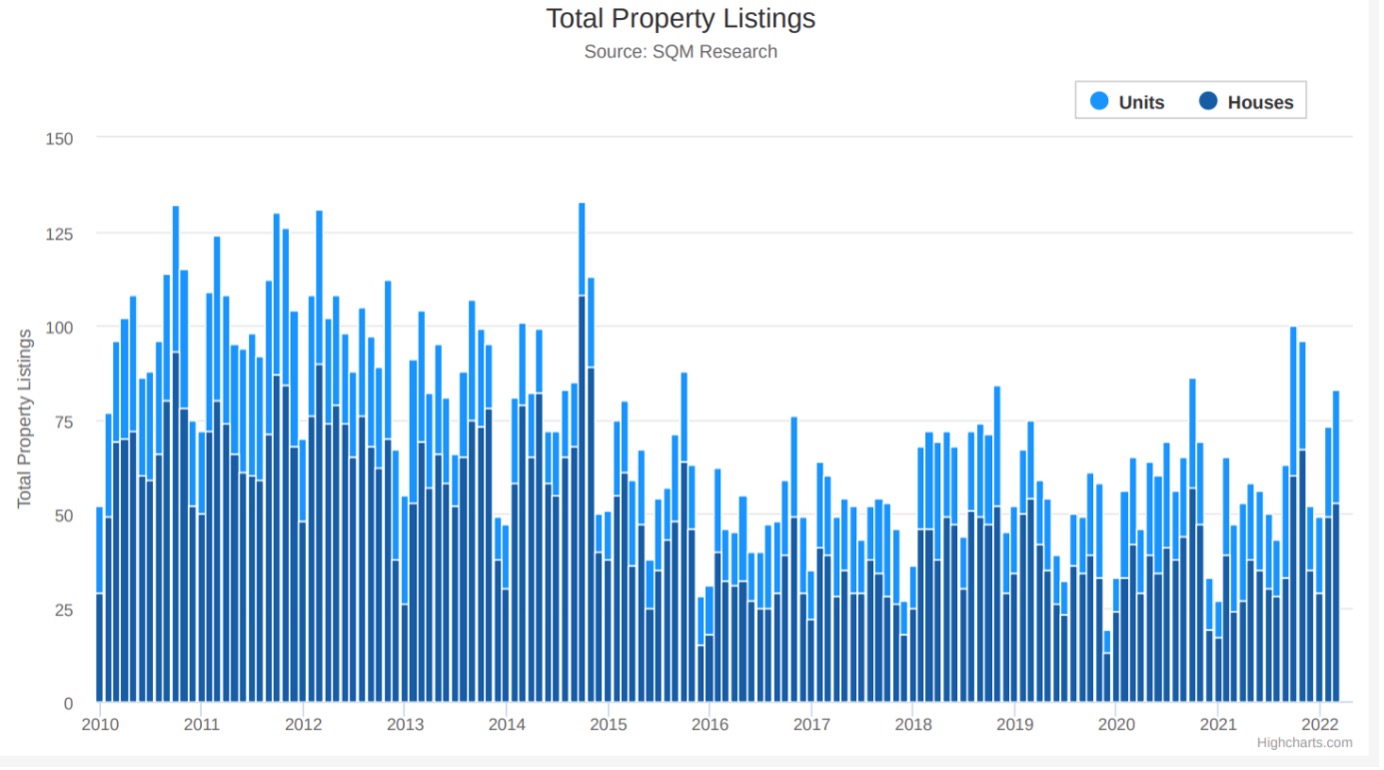
The increase in numbers shown within the first quarter matches what was seen on the streets and reports via property portals, particularly within Paddington. Off market and online advertisements increased dramatically this quarter. After the expected hiatus over late November into December, numbers were consistently higher over the following three months (over 75 for both February and March) than most month in 2021 when lockdowns heavily influenced vendors and many held off putting properties up for sale. This strong presence of quality listings within both Eastern Suburbs and Paddington had the expected knock-on effect of prices capping out or reducing slightly to meet the changes in demand. Interesting to note that the strong prices achieved since 2017 are representative of the lower volumes on market compared to the period covering 2010-2016, where 75-110 properties were listed almost every month creating lower and less volatile growth rates.
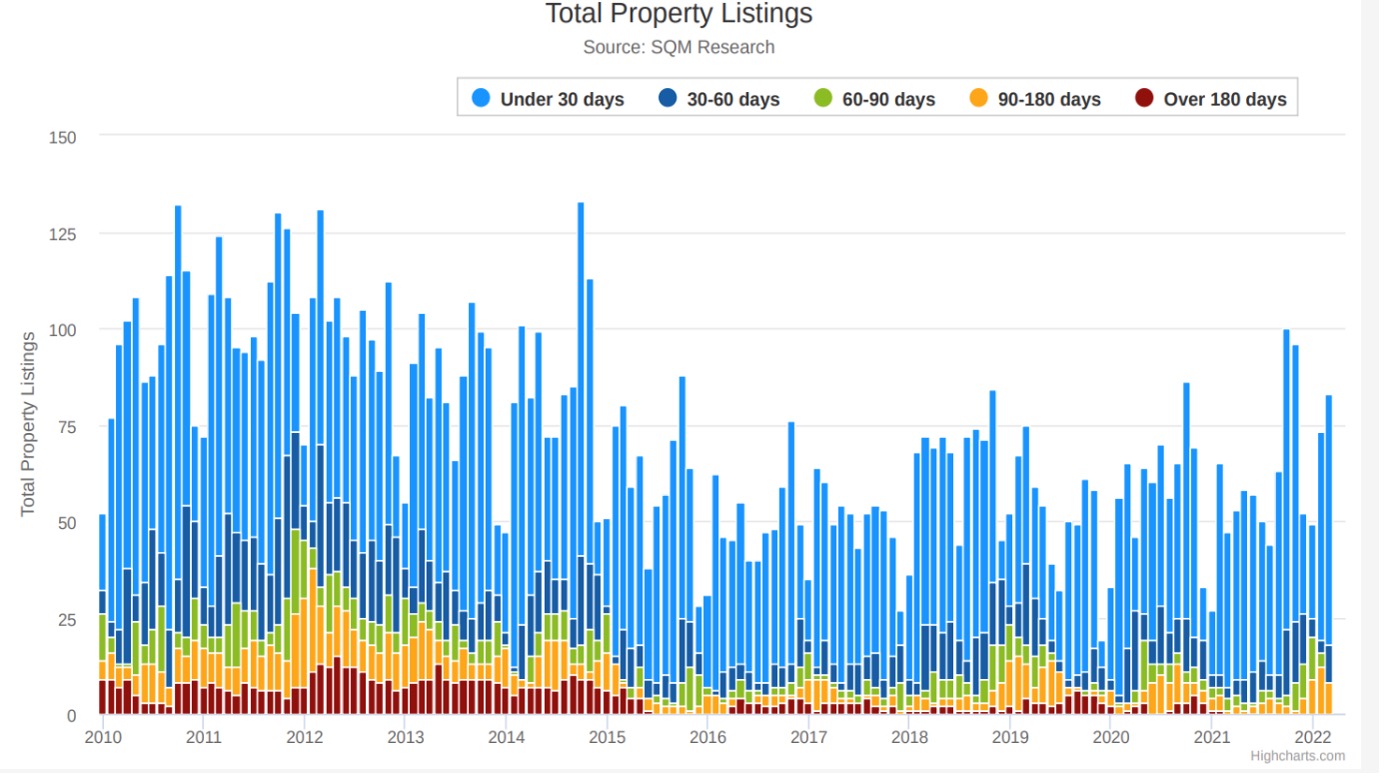
The above graph shows the number of properties, and days, on the market. It clearly illustrates that the 30-90 days on market (dark blue and green) increased enormously compared to most of 2021. Of most significant note is the amount of 90-180 days (yellow) over past 3 months, higher than the past 1 ½ years. This is indicative of vendors inability to adjust to the changing market, while buyers had already caught up. Resulting in vendors still demanding bull market November/December prices, while buyers were well aware of the cooled conditions and unwilling to compromise. The role of the buyers agent became crucial in bridging the gap between vendor/seller expectations and what buyers were willing to pay. Even the same buyers were pulling back on their own offers, such as in a Hargrave St, Paddington property that received an offer of $4.15m at the end of last year when its campaign began. When approached this year to sign the contract they retracted the offer and said they were only willing to offer $3.8-3.9 for it.
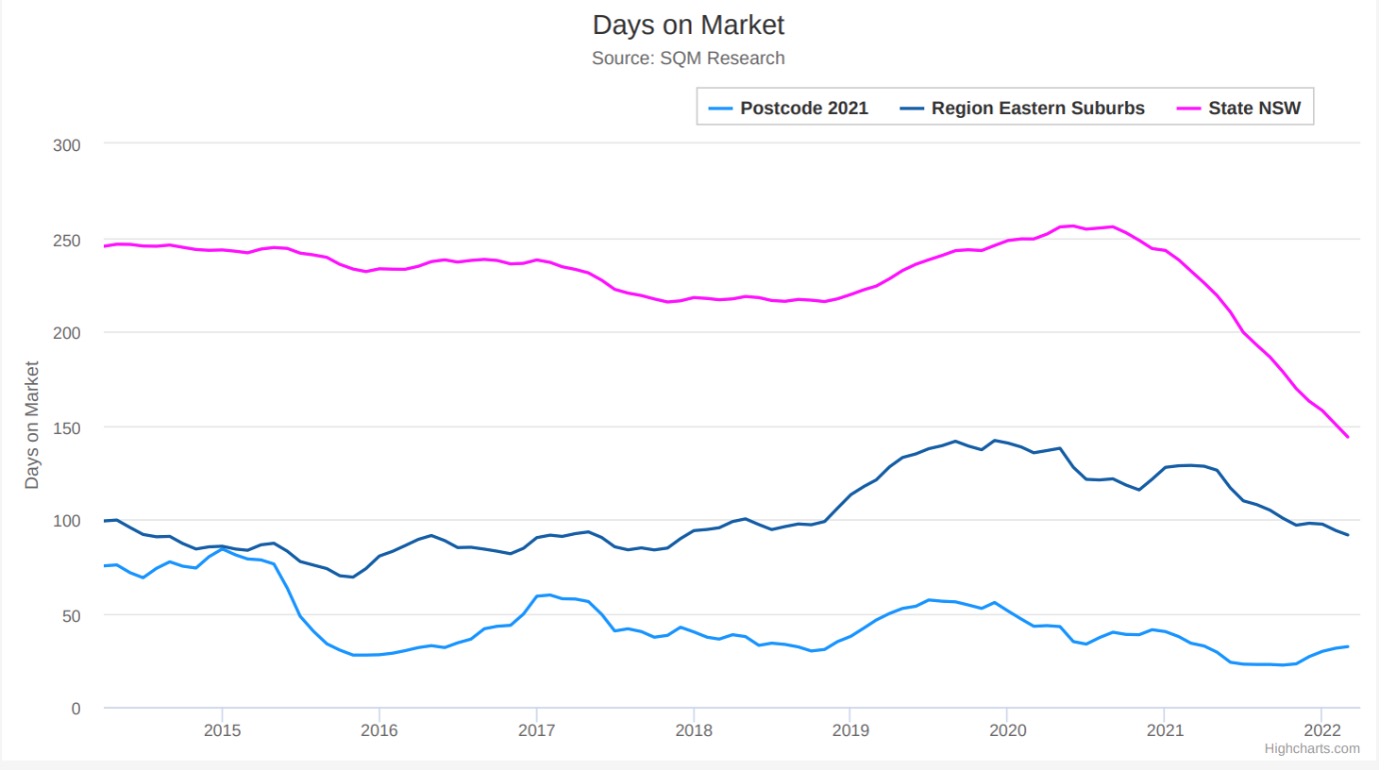
The above graph compares Paddington with the Eastern Suburbs. Days on market in Paddington took an upturn this quarter, increasing to 37 days following a dramatic drop from 50 down to 25 from Jan 2020 to Sept 2021 during the peak of the price increases. Eastern Suburbs however has been on the decrease for the past 2 years, though it is still more than double Paddington’s figures. This does confirm why Paddington has been performing so well over past 12 months, when comparing it to NSW as a whole, which has been in a steep decline this quarter. The property market is like a scrambled egg, lumpy and smooth in parts. This graph demonstrates these vastly different changes in days on market in NSW, the Eastern Suburbs, and Paddington.
Adding to the mix, available stock increased and overall prices began to plateau. In relation to many other areas within Sydney, the median prices within Paddington are higher, with terraces typically selling for $34,000 per square metre. However, the rarer large land holdings of around 200m are still commanding record prices due to the high demand and small supply. Six months ago three properties on Windsor Street, Elizabeth Street, and Flinton Street, Paddington, sold for between $8.25-$8.4m on 195-208m of land, equating to $38,000 -$41,000 per square metre. Confirming that these larger more expensive properties continue to perform was the sale of a beautifully restored 1970’s terrace on Windsor St, Paddington, on almost 190m of land, selling a month ago for a close to record price of $50,000 per square metre. Perhaps this is because at this wealth value, bank loans are not so relevant, or the buyers are possibly downsizers from larger properties in the East so can easily afford these higher prices. Either way, premium properties seem to defy all the bumps in the property market road.
Looking ahead, numerous looming influences such as the upcoming election and interest rate changes will likely shape the forward progression of the patterns and trends of the above graphs quite markedly. This could herald the start of an entirely new property cycle. It will be interesting to look back in another quarter to see to what level these changes have evolved.
Get in touch with David to find out more about the Eastern Suburbs market, or make an appointment to discuss your requirements and see how we can help you get into your ideal home sooner.
Read more about David Turnbull-
 Kingston – Summer 2024/25 Market ReviewRead Article
 -
 Boroondara – Spring 2024 Market ReviewRead Article
 -
 Kingston – Winter 2024 Market ReviewRead Article
 -
 Boroondara – Winter 2024 Market UpdateRead Article
 -
 Melbourne Inner North – Winter 2024 UpdateRead Article
 -
 Melbourne Inner West / North – Winter 2024 UpdateRead Article
The first step in your property journey, whether it be buying or selling, is gaining clarity on your situation.

