2017355615_4_1_211025_111246-w1600-h1067

Mornington Peninsula 2021 Annual Property Review

2017355615_4_1_211025_111246-w1600-h1067
Jan 08, 2022

As the 2021 real estate year comes to an end, we reflect on the unique year we just had, the highs and lows, and the predictions that nearly everyone including economists got wrong. We all endured more lockdowns, some of us had the additional stress and time constraints of home-schooling, whilst others continued the unpredictable restrictions on workplaces and businesses. All the while, the Mornington Peninsula property market continued to defy any fear of job losses and industry shutdowns, with extreme growth driven by high demand and low supply.

Metropolitan Melbourne (which rightly or wrongly includes the Mornington Peninsula) was forced into tight real estate restrictions yet again over the winter months, mirroring the ban on inspections that we faced in 2020. This led some buyers yet again to purchase properties sight unseen – a dangerous tactic particularly on homes that carry significant value in the building.

The Mornington Peninsula surged ahead of the rest of Melbourne in terms of price growth, with some beachside suburbs experiencing growth of more than 40% over the previous 12 months. St Andrews Beach, Portsea and Rye being good examples of markets that had a huge increase in price growth. The former two were driven by a short supply, but the latter, Rye, became the affordable compromise market that attracted holiday home buyers looking for an escape from the daily grind.

In the 12 months prior, Blairgowrie had been the star performer, where land prices hovered around $1,500 per sqm. Fast forward to the middle of 2021 and land prices had surpassed 2,000 per sqm. This level now challenged Sorrento and consequently, buyer depth dropped away. The ripple effect meant that priced-out buyers were now looking at Tyrone Foreshore in Rye for some price relief whilst still having proximity to the quieter beaches and village.

St Andrews Beach and Portsea are perennial short supply markets and had come off long periods of subdued growth, therefore were due to catch up, but I don’t think anyone predicted the level that buyers were prepared to push prices. I’ll go over some specific results in the local market wraps below, but so far as to say that agents had all sorts of trouble quoting listings going to auction.

As we came out of our snap 7-day lockdown that lasted 12 weeks, overhanging properties were once again snapped up quickly and any hopes of more balanced supply were quashed when new listings only came through in dribs and drabs. As we approach the end of the year, buyer enquiries have dropped off according to most agents I have spoken to, and there’s a feeling of a more balanced status quo.

Enter Omicron, a new strain to test the market a third time. We saw the Alpha and then Delta variants have a positive effect on buyer demand, will we see this again in the new year? Enter the current inflation problem and mortgage fixed rate increases, which always signal the banks’ view on what the RBA will do in the future. Also enter the Federal Election, which has a history of cooling property markets. Will we see the market continue to grow, or have we now reached a ceiling? Which way will it go from here?

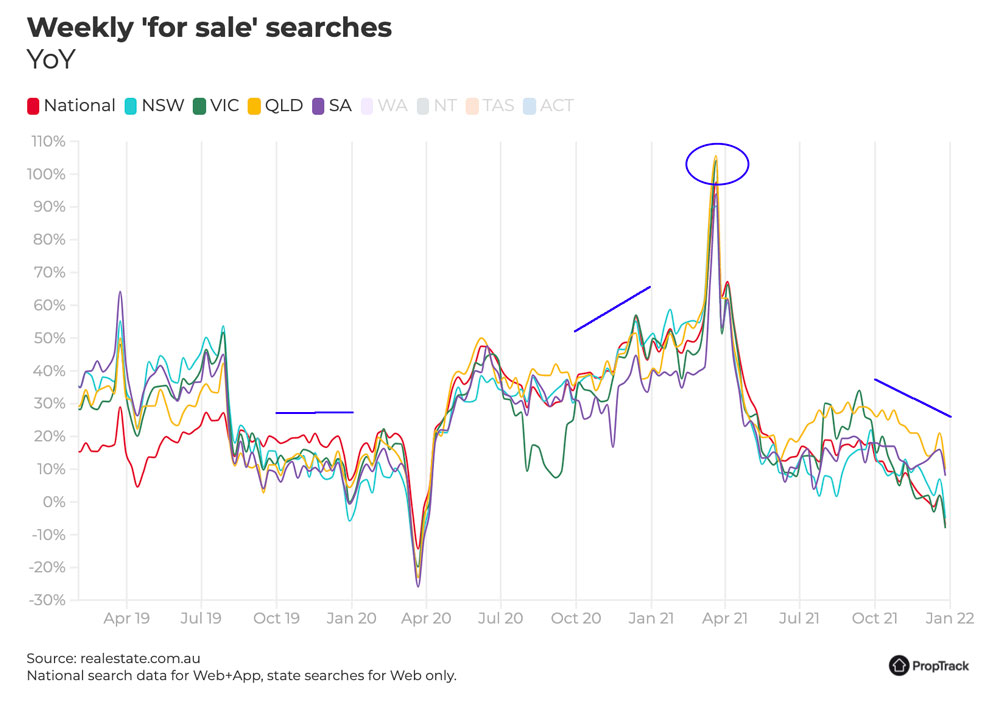
As we can see in the PropTrack weekly searches index (replacing the REA demand indicator) we can see the activity from buyers across the last quarter of the year for the past 3 years. The trend in 2019 was a balanced market, the last quarter of 2020 was a high demand market, and finally this year in 2021, the buyer demand has trended down to finish the year at the same demand levels as 2019. Could this be the signal that we’ve now returned to a balanced market? As I had written in my mid-year update, I believed the top of the market was reached in March/April, and this can be seen where I have circled the peak of the search demand. Yes, we were subjected to lockdown for 3 months during winter, but the drop in demand from April to July was evident that buyers were starting to keep their hands in their pockets.

Weekly For Sale Search

Demand on the Mornington Peninsula has come off its all-time high for many of the reasons that we have highlighted, but it has been a very long 12 months and you could argue that everyone is tired, needs a break, and is focussed on a well-derserved family holiday. Nearly all the agents I deal with have taken time off this January, some away for a few weeks – which is a signal to me that not only has the heat come off a little bit, but they really need a break.

I am now questioning who holds the power, it has been the sellers for a good 12-18 months. I have a feeling this is now swinging back in the favour of buyers, but I am not yet calling it a “buyers market”. It may be more balanced across the board than before, but sellers generally still seem to have a slight advantage.

Now is the perfect time to engage with BuyerX and plan a strategy for your next move, to avoid rushing into a decision under pressure when opportunities next arise.

Below is an overview of the major million-plus markets on the Peninsula, with apologies to some of the fringe areas which are not featured below (please get in touch for my assessment of these markets if you are interested).

  • Northern Tip
  • Around the Hill
  • Southern End
Northern Tip

After a solid 4-6 months of growth prior to the beginning of 2021 on the Northern Tip of the Peninsula, the following 6 months to the end of June continued to surge ahead, particularly in Mt Eliza & Mt Martha. The second half of the year told a slightly different story as the Winter period was spent in lockdown and the sales volumes declined due to restrictions on inspections. The days on market crept up naturally during the closed market, and then recovered soon after.

Mount Eliza
Seller’s market

January – March
# of Transactions: 143
Total: $258,794,554
Median: $1,560,000
Max: $7,080,000

July – September
# of Transactions: 122
Total: $188,440,449
Median: $1,700,000
Max: $6,250,000

April – June
# of Transactions: 99
Total: $187,352,625
Median: $1,720,000
Max: $5,000,000

October – December
# of Transactions: 117
Total: $225,135,404
Median: $1,860,000
Max: $7,950,000

In Mt Eliza, the days on market is around 21 days currently, down from 31 days prior to the Winter lockdown period. This is not surprising given the time of year, and the lack of stock for sale. It is slightly higher than the peak at 19 days. Where we are seeing strength still is the $1.6-2.4M bracket, where homes are selling in under 3 weeks, closely followed by the $2.5-3.5M bracket where three to four weeks is a reasonable timeframe. Between $3.5-4.5M the volume of sales are lower and less reliable, however, the data shows under 4 weeks time on market which is still quite strong. Above $5M was some of the quickest sales of the year, and there is still good buyer demand in the top end of Mt Eliza.

There have been some top end sales in short periods such as 9 Watts Pde (12 days – $5.1M – Aqua Real Estate), 110 Shotton Rd (17 days – $4.6M – Aqua Real Estate), 95 Shotton Rd (Off-market – $5M – Aqua Real Estate), 16 Tourello Rd (13 days – $4.3M – Marshall White Real Estate), 110 Cobb Rd (22 days – $7.95M – McEwing Partners), 31 Jacksons Rd (Off-market – $5.795M – Aqua Real Estate) and 45 Canadian Bay Rd (Off-market – $6.175M – McEwing Partners), 42 Jacksons Rd (15 days – $6.25M – Sotheby’s). Some of these offered off-market prior to listing.

I recently asked Vicki Sayers of RT Edgar for her thoughts on the year, “Despite the measures we’ve had to put into place to assist vendors to sell and buyers to buy, as an office, we’ve had a record number of sales for the year. We’ve seen unprecedented growth in the median house prices from Frankston South to Mount Martha, and buyer demand is between 37 and 63% higher than the average across Victoria. Rental demand is also high across all these four suburbs. In recent months, we’ve achieved record prices across multiple streets in Mount Martha and Mount Eliza. We don’t see the demand to live here changing anytime soon.”

Mount Martha
Slight Seller’s market, with supply issues.

January – March
# of Transactions: 157
Total: $244,557,854
Median: $1,250,000
Max: $6,800,000

July – September
# of Transactions: 69
Total: $106,922,800
Median: $1,730,000
Max: $5,500,000

April – June
# of Transactions: 104
Total: $172,279,200
Median: $1,500,200
Max: $5,910,000

October – December
# of Transactions: 98
Total: $174,107,001
Median: $1,815,000
Max: $5,050,000

In Mt Martha, the average days on market is currently at 35, up from 22 days at the halfway point of 2021. A similar story to the rest of the Peninsula where sales were few and far between during lockdown, but homes then keenly snapped up in the following months as we headed towards Christmas. Beachside properties under $2M are snapped up within the first couple of weeks, and homes in the $1.6-1.8M bracket at the beginning of the year are now fetching $2M due to a lack of available choice.

Despite the days on market creep, I still believe Mount Martha to have an imbalance of supply & demand, but it feels isolated to the quality homes in good locations. Despite the recent soaring price growth, the buyer depth and lack of quality homes available keeps Mt Martha in a slight seller’s market. Buyers from Melbourne are keenly watching for homes with renovation potential on large blocks walking distance to the beach. The problem is that there are very few sellers in this category wanting to offload because there aren’t many quality options for them to upgrade to.

I asked Dean Phillips of McEwing & Partners to give his thoughts on the market. “The extraordinary momentum carried over from 2020, coupled with monetary and fiscal stimulus measures has contributed to an unprecedented year of growth and litany of outstanding results for the Mornington Peninsula residential housing market. McEwing & Partners have an extremely experienced and dynamic team and were able to adjust to the changing pace of the year. In 2021 our team achieved $351 million of property sales and over 200 properties sold. Our auction clearance rates were 100% for the year with only one property passing in and selling directly afterward at the vendor’s reserve. 2021 was a year of many highlights. In particular, the auctions of 44 Marine Drive, Safety Beach selling $1,071,000 over the reserve, 186 Point Leo Road, Red Hill selling $600,000 above the reserve, 319 Nepean Highway, Mount Martha selling $1,200,000 over the reserve, and of course 841 and 842 Esplanade, Mornington selling collectively $1,300,000 over the reserve. We are looking forward to the first quarter of 2022 bringing very much of the same.”

Mornington
Balanced market

January – March
# of Transactions: 255
Total: $285,967,633
Median: $910,000
Max: $7,500,000

July – September
# of Transactions: 170
Total: $198,792,468
Median: $1,167,500
Max: $13,500,000

April – June
# of Transactions: 156
Total: $176,874,132
Median: $967,500
Max: $5,325,000

October – December
# of Transactions: 135
Total: $166,291,937
Median: $1,162,500
Max: $4,500,000

In Mornington, the average days on market is around 35 days currently, up from 30 days at mid-year. Again, as with all suburbs on the Peninsula, the winter months were subject to lockdown restrictions impacting the market so the days on market and sales volumes were abnormally affected. The year started in the same fashion as 2020 finished, with unprecedented ferocity by buyers looking to move into the area. Many of these from Melbourne, appreciating the flexibility of working from home with a manageable commute to inner-city workplaces when required. The first home buyer market saw entry points in the 600s turn into 800s in the blink of an eye. The newer estates now with a $1M+ entry point. Beachside homes are also no longer achievable under $1.2M, largely thanks to the developer market which continues to churn out the two and three site townhouses.

It does feel that the market may have reached a peak in Mornington. Anecdotally, we’re seeing fewer buyers around and properties are taking longer to sell as the year rolls on. It certainly doesn’t have the same frantic feel as March/April did. I am leaning towards Mornington now shifting to a balanced market – neither in favour of buyers or sellers.

The Beleura Hill precinct didn’t have much activity in the second half of the year, after some strong results in the first few months. One exceptional sale was the clifftop landmark property at 29-31 Kalimna Drive listed and sold by Alex Corradi of Danckert Real Estate, in excess of $13M. It took some time to sell, but that is to be expected with a home at this level in Mornington.

Around the Hill

The extreme buyer demand and depth “around the hill” has not waivered throughout 2021. A consistent days on market figure hovering around 28 days in the first half of the year and now at 26 days, largely due to unseasonably low stock levels, and the lack of international travel forcing would-be travellers to find their own escapes in the country-side. Hobby farms are now prized possessions and 50% more expensive now than pre-covid in some cases at the low end. We saw incredible auction results coming into the finish of last year, and that continued into 2021 with strong results and buyer depth.

Seller’s market
January – June
# of Transactions: 36
Total: $100,338,000
Median: $2,980,000
Max: $20,000,000+

July – December
# of Transactions: 50
Total: $147,354,000
Median: $3,235,000
Max: $14,000,000

A spattering of 6-7M off market and private sales early in the year by Kay & Burton occurred in Flinders and Red Hill in classic streets such as Paringa and Keys roads, and in Main Ridge the $8.5M sale of “Patterdale” with touches by Stephen Akehurst. The big one though, was the much anticipated cutting edge luxury “Horizon” in Flinders in March overlooking Bass Strait built by the Williams Group and sold to an international buyer via Rob Curtain of Sotheby’s for over $20M.

The entry point into acreages, if you can find it, sits around $3M now. There is just a real lack of motivation from sellers to part with their piece of dirt. We saw a few big sales in the second half of the year in the $7M, $9M, $12M and $14M range in Flinders, in Punchbowl Rd, Meakins Rd, Boyds Rd and the coveted Musk Creek Rd, to complement the $20M Horizon sale in Flinders in the early part. The big money seems to have returned in 2021.

Southern End

There is still strength in the southern end of the market, however, buyers are now more discerning. Quality A-grade homes are getting mid-to-top of the range, but B and C-grade homes are sitting there and some are changing hands with agents – price adjusting and revamping marketing campaigns.

Stock levels continue to be low, which is probably avoiding the market from turning into a buyer’s market. Things can change again quickly, so it may just be a momentary pause or breather over summer and we may see the market “kick” again towards the end of January. Right now, it is a wait-and-watch.

Portsea
Seller’s market, on low stock volumes.

January – June
# of Transactions: 43
Total: $149,991,000
Median: $2,950,000
Max: $22,200,000

July – December
# of Transactions: 21
Total: $105,197,333
Median: $3,81,000
Max: $16,000,000

If you ignore the $9.25M 161 day-on-market sale at 26 Macgregor Ave, the Portsea days on market is still sitting at 26 days, albeit on very low stock volumes. In the second half of the year, we had 50% of the sale volume in the first half of the year, which helped keep the buyer demand strong. I am not confident that we would have the same days on market number if the sales volume had remained the same all year, but for now, I am leaving Portsea as a Seller’s Market.

Early into 2021, we also saw a huge price achieved with Rob Curtain of Sotheby’s private auction of 3 Franklin Rd, the clifftop home on an acre of land, fetching a whopping $22.2M – nearly $6M over the published reserve. Sotheby’s continued to dominate the top end with sales such as 9 Wimbledon ($8.3M) and 71 Blair ($7.25M) to go alongside 26-30 Macgregor ($9.25M) and 22 Leyden ($16M) – the corner piece of the 3/4 acre block subsequently going up for auction with RT Edgar at 24 Leyden and selling in a frenzy for $2.92M – about $500k over the top of the range.

Sorrento
Seller’s market.

January – June
# of Transactions: 87
Total: $202,872,060
Median: $1,935,000
Max: $12,200,000

July – December
# of Transactions: 62
Total: $152,339,750
Median: $2,500,000
Max: $5,900,000

A low stock environment all year in Sorrento, with the average days on market consistently hovering around 28 days in the first half of the year, and then continuing to fall to a level currently of 25 days. Interestingly, during the winter lockdown period, days on market fell to 19 as we saw panic buying at unprecedented levels in Sorrento and Blairgowrie. Many homes were bought sight unseen, or via vendor-led video tours. Zoom auctions became the norm, and prices were very strong. The median jumped $500k from the start to the end of the year. This was fuelled by better quality homes coming onto the market, and believe it or not, the ripple effect of its poorer cousin, Blairgowrie, who had a boom of its own in the 6-months earlier.

The power still marginally lies with the sellers in Sorrento, albeit on low stock volumes much like Portsea.

I spoke with Troy Schwarze of Jellis Craig for his thoughts on the market, “Another year interrupted by Covid19 lockdowns saw property prices across the Mornington Peninsula rise rapidly on the back of a strong 2020. Demand for properties across all price points hit levels that resulted in sales well in excess of vendor demands. Properties were selling in days, and some didn’t even reach the market such was the strength of the buyer pool and the lack of stock on the market. On a personal level, I made some sales that put me on the map and represented some beautiful properties and lovely vendors. I need to thank Emil Foller for his direction and leadership. 2022 has started in a similar fashion and while the buyer pool may be smaller the quality is there, and people are seeing the Mornington Peninsula as a great place to invest and create memories for their families for generations to come.”

Blairgowrie
Slight Seller’s market

January – March
# of Transactions: 61
Total: $98,733,036
Median: $1,400,000
Max: $3,850,000

July – September
# of Transactions: 39
Total: $71,184,995
Median: $1,744,000
Max: $3,560,000

April – June
# of Transactions: 26
Total: $41,756,024
Median: $1,500,000
Max: $9,000,000

October – December
# of Transactions: 40
Total: $76,331,000
Median: $1,898,500
Max: $3,230,000

The average days on market in Blairgowrie is 22 days, and still arguably the strongest market on the Peninsula in terms of buyers waiting on the sidelines for housing stock. What we are seeing in Blairgowrie, however, is perhaps an affordability ceiling has been reached. The aggressive jump in prices early in the year was a catalyst, alongside Portsea, for Sorrento to kick into gear. As we saw in Sorrento during the lockdown period, Blairgowrie too was a market of buyers taking the plunge and buying sight-unseen, with zoom auctions also becoming the norm. Even though the days on market figure is strong at 22 days, we are anecdotally hearing of less buyer depth and witnessing sale prices staying within the quoted range on the most part. I am not brave enough to call this market balanced just yet, but it does feel to me that it is heading in this direction.

What can we expect on the Peninsula for the first half of 2022?

It has been a rollercoaster of a year on the Mornington Peninsula, but agents, vendors, and buyers have adapted to the market environment with little commotion. Timid buyers who waited to see what the market was doing have been priced out of areas they started their searches in. Other buyers who were brave, and possibly felt they were overpaying at the time, are now sitting on 30% additional equity from the start of the year. We guided over 40 clients this year through the process and many conversations were had regarding “what-ifs”. Having the market knowledge, relationships with the agents, experience in difficult situations, and access to homes off-market have put those 40 clients in a great position moving forward.

It isn’t clear how long we will continue to see the market across the Peninsula enjoy the same buoyancy that we’ve seen for the past 12-18 months, but the data shows buyer depth is still strong enough on the low stock volumes to support price growth. If we have an increase in supply, we may start to see some stagnation, but I doubt we will see any retracement in price. Affordability is now being challenged, and as interest rates look likely to rise later this year, it may put the brakes on price growth – regardless of listing volumes. A-grade homes will continue to have demand from buyers, and that’s where savvy buyers will focus this year.

Contact us see what we have got in the way of off-market listings in our database, there might be one that matches your search brief. Nonetheless, having a local expert on the ground, with a finger on the pulse of prices and knowing where to buy could be the difference between you being successful or missing out. Talk to us today and we will give you an honest opinion of the likelihood of what you are trying to achieve.

Mornington Peninsula Area Specialist
Michael Sier

Get in touch with Michael to find out more about the Mornington Peninsula property market, or make an appointment to discuss your requirements and see how we can help you get into your ideal home sooner.

Read more about Michael Sier
Previous Updates
Recent Posts
Free Consultation

The first step in your property journey, whether it be buying or selling, is gaining clarity on your situation.

buyerx_logo
Book a Free
Consultation
Or fill out a form Free Consultation